

Australia’s Housing Gap by State (2026): The Honest Numbers
You have seen the headline: Australia is not building enough homes. It is repeated in every property report, on every news bulletin, and across a thousand infographics. If you are trying to buy, that gap is not an abstract statistic, it decides how much competition you will face and whether waiting for prices to fall is a real plan or a trap. But when you look at the actual numbers, the story is more interesting, and more honest, than the panic suggests. In the year to December 2025 the country grew by 412,500 people and approved 196,832 new homes. Whether that is a crisis, a modest gap or a rough balance depends entirely on one assumption almost nobody states out loud: how many people you think should live in each new home. This piece shows both methods, state by state, using nothing but official ABS figures, and explains what it means if you are the one trying to buy.
- In the year to December 2025 Australia grew by 412,500 people and approved 196,832 new homes. Whether that is a shortfall depends entirely on how you count it.
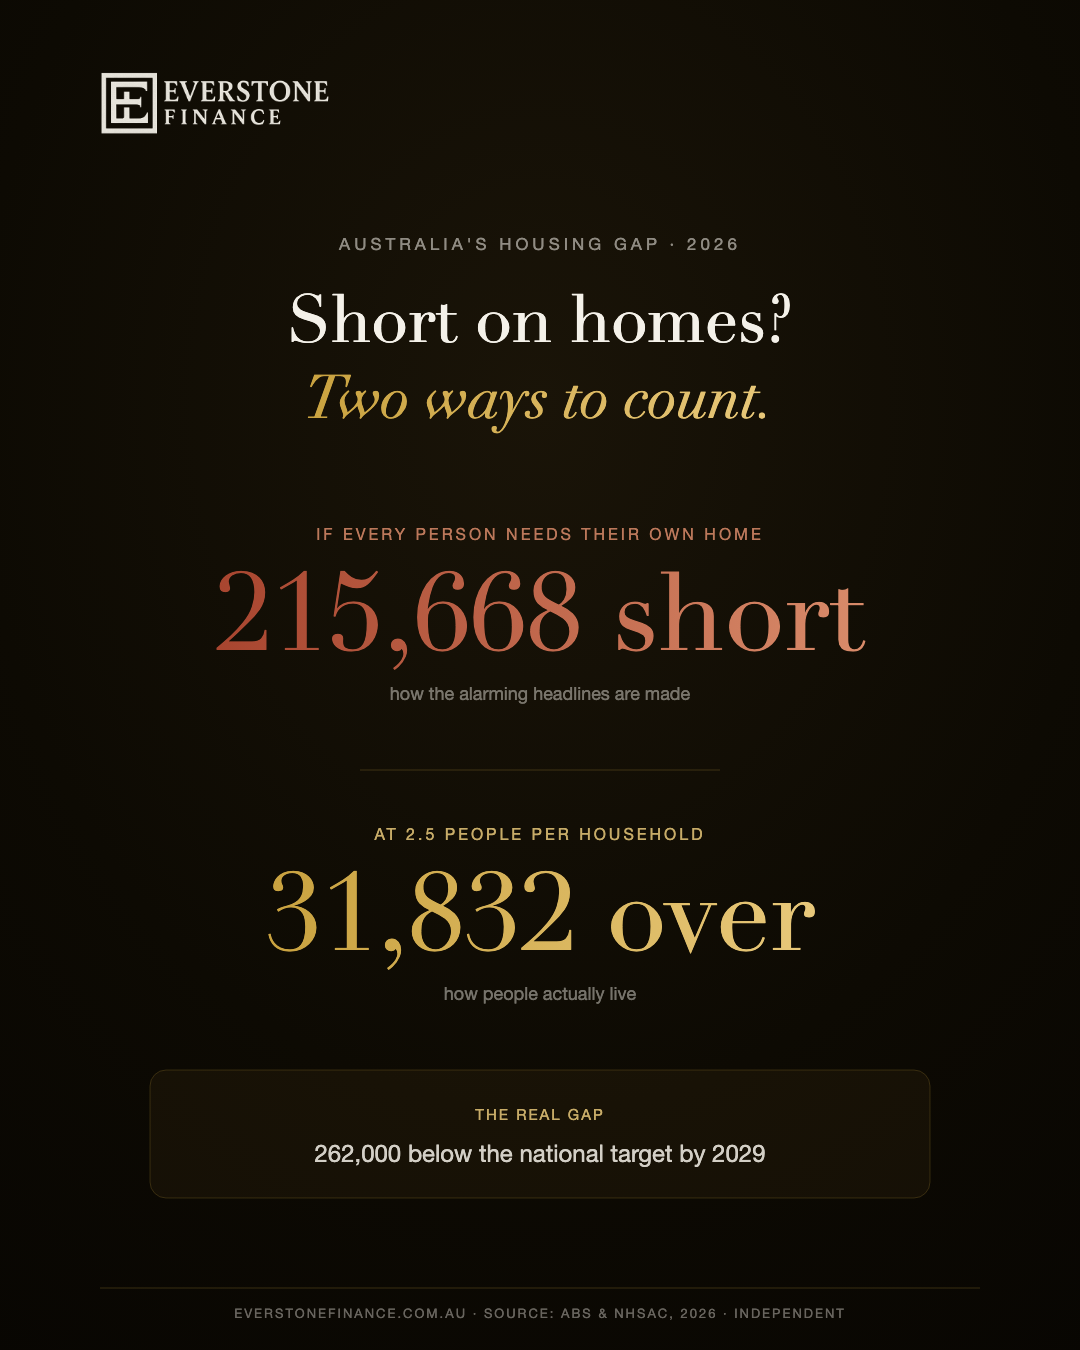
- Count one home per person and the gap looks like 215,668 homes. Count one home per 2.5-person household and there is a small surplus of about 31,832 on paper.
- The honest gap is not people versus homes, it is homes versus target: the National Housing Accord asks for 240,000 homes a year, and approvals fall about 43,000 short.
- This piece shows both methods honestly, state by state, and what it means if you are trying to buy. If you want it applied to your own plans, book a free chat with a former banker.
- Why does the “housing shortfall” number depend on how you count?
- What is the housing gap by state, both ways?
- So is there really a housing shortage?
- Which states are under the most pressure?
- What does undersupply mean for prices and rents?
- What does this mean if you are trying to buy?
- Frequently asked questions
Why does the “housing shortfall” number depend on how you count?
Because the “gap” is population growth minus new homes, and the answer swings entirely on how many people you assume live in each home. One home per new person produces a national gap of 215,668. One home per 2.5-person household produces a small surplus of about 31,832. Neither is the whole truth.
There are two honest ways to turn population growth into a housing number, and the difference between them is enormous. It is worth understanding both, because whenever you see a dramatic shortfall figure, one of these two methods is sitting underneath it, usually unstated.
Method one, one home per new person. Take the 412,500 people Australia added in the year to December 2025 and subtract the 196,832 homes approved. That leaves a gap of 215,668 homes. This is how the most alarming headlines and infographics are often built, and the number is genuinely large. The problem is that it quietly assumes every new person needs their own separate dwelling, which is not how anyone lives. Australians share homes, about 2.5 people to a household on average, so this method overstates the real demand for new dwellings by a wide margin.
Method two, one home per 2.5-person household. Divide the same 412,500 people by the average household size of 2.5, and you get roughly 165,000 homes of genuine new demand. Set that against the 196,832 homes approved and the country is not short at all on this measure. It is ahead by about 31,832 approvals on paper. This method is closer to how households actually form, but it is not the full truth either, because it assumes every approval becomes a finished home, and it treats 2.5 as fixed when household size is slowly falling.
So the same year, the same two official numbers, produce either a 215,668-home crisis or a 31,832-home surplus depending purely on the assumption you choose. We think you deserve to see both rather than be handed one and told it is the answer. The truer picture, as we will show, sits in a third comparison entirely: homes against the national building target.
What is the housing gap by state, both ways?
Here is every state and territory, with population growth, homes approved, and the gap calculated both ways. Read across each row and you can see how differently the two methods treat the same state. The final column, people per new home approved, is the cleanest single measure of pressure.
The table below uses ABS population growth for the year ending December 2025 and ABS dwelling approvals over the same 12 months. A negative gap is a shortfall (marked in orange); a positive gap means approvals ran ahead of that method’s demand.
| State | Population growth | New homes approved | Gap if 1 home per person | Gap at 2.5 people per household | People per new home |
|---|---|---|---|---|---|
| NSW | 104,600 | 52,994 | -51,606 | +11,154 | 2.0 |
| VIC | 117,300 | 54,630 | -62,670 | +7,710 | 2.1 |
| QLD | 92,200 | 42,382 | -49,818 | +5,502 | 2.2 |
| WA | 65,500 | 24,088 | -41,412 | -2,112 | 2.7 |
| SA | 19,700 | 15,010 | -4,690 | +7,130 | 1.3 |
| ACT | 6,000 | 4,468 | -1,532 | +2,068 | 1.3 |
| NT | 4,200 | 823 | -3,377 | -857 | 5.1 |
| TAS | 2,900 | 2,437 | -463 | +1,277 | 1.2 |
| Australia | 412,500 | 196,832 | -215,668 | +31,832 | 2.1 |
Population: ABS, year ending December 2025. New homes: ABS dwelling approvals (a 12-month total; approvals run ahead of completions, which were closer to 175,000). The 2.5 figure is the average Australian household size.
Notice what happens as you read across. Under the one-home-per-person method every single state shows a shortfall, and the national figure is a stark 215,668. Switch to the household method and most of those shortfalls vanish, only Western Australia and the Northern Territory stay negative. That is not a trick; it is the whole point. The method decides the mood of the story, which is exactly why the honest thing to do is show you both and let the final column, people per new home, do the real work.
Trying to buy while the supply debate goes around in circles? WhatsApp, text or call Ahmed about your own deposit and borrowing position. His own mobile, no call centre, and no obligation.
So is there really a housing shortage?
Yes, but the honest gap is not people versus homes, it is homes versus target. The National Housing Accord calls for 240,000 homes a year. Approvals of 196,832 fall about 43,000 short of that, and actual completions of around 175,000 fall about 65,000 short. That is the shortage that matters.
Once you accept that the people-versus-homes framing swings on an assumption, the useful question changes. It is not “are we building one home per new Australian,” it is “are we building enough homes to keep housing affordable.” That is a target the country has actually set for itself, so it can be measured against something concrete rather than a debatable ratio.
The National Housing Accord calls for 240,000 new homes a year to restore affordability. Measured against that goal, the picture is clearly short, but by a sober amount rather than a frightening one:
Over five years the numbers compound. The National Housing Supply and Affordability Council projects about 938,000 homes will be built against the 1.2 million the Accord targets, a shortfall of 262,000 homes by 2029. The Urban Development Institute of Australia is more pessimistic again, estimating around 400,000 fewer homes than needed across the capital cities by 2029.
Two things push the real shortage a little wider than even the household method suggests. First, completions lag approvals: a home that is approved is not a home someone can live in, and completions of about 175,000 sit well below the 196,832 approved, so the pipeline is thinner than the approvals headline implies. Second, average household size is slowly falling as the population ages and more people live alone, which means the true 2.5 divisor is drifting downward over time and lifting genuine demand. Both effects point the same way: the target-based shortage is real, even if the one-home-per-person crisis figure is overstated.
Which states are under the most pressure?
Look at the people-per-new-home column. Western Australia (2.7) and the Northern Territory (5.1) are still short even on the generous household method. South Australia, Tasmania and the ACT are approving relatively generously against their growth. NSW, Victoria and Queensland approve enough on the household method but absorb the largest raw population inflows.
The cleanest way to rank pressure is the final column of the table, people per new home approved, because it strips out the size of the state and shows how hard each new dwelling is being asked to work.
Tightest supply: Western Australia and the Northern Territory. These are the only two jurisdictions that stay in shortfall even under the forgiving 2.5-person method. Western Australia is approving one home for every 2.7 people it adds, which is above the national household ratio, so its approvals are not keeping pace with a fast-growing population. The Northern Territory is the standout at 5.1 people per new home, driven by very low approval numbers (just 823 for the year) against steady population growth. In raw terms the Territory’s gap is small, but per new home it is the tightest in the country.
Approving generously: South Australia, Tasmania and the ACT. South Australia (1.3 people per approval), Tasmania (1.2) and the ACT (1.3) are all building well ahead of their population growth on this measure. These are smaller markets adding fewer people, and their approval volumes comfortably cover new household demand, which is why all three show a clear surplus under the household method.
Large inflows, adequate approvals: NSW, Victoria and Queensland. The three biggest states each clear the household-method bar, NSW at 2.0 people per home, Victoria at 2.1 and Queensland at 2.2, so on paper their approvals match new demand. But they are also absorbing by far the largest population inflows (104,600, 117,300 and 92,200 respectively), which means any slippage between approvals and finished homes is felt by a much larger number of people. Adequate on the ratio does not always feel adequate on the ground.
What does undersupply mean for prices and rents?
Housing responds to supply and demand like any market. When building runs persistently below the target set to keep housing affordable, that shortfall supports prices and rents over time. It does not guarantee a straight line up, but it removes the pressure valve that abundant new supply would otherwise provide.
The economics here are plain, and we will not dress them up. When the number of new homes falls short of the number the country has decided it needs, the existing stock has to absorb more of the demand, and that competition shows up in both purchase prices and rents. A 43,000-home annual gap against target, compounding toward a projected 262,000-home shortfall by 2029, is exactly the kind of persistent undersupply that keeps upward pressure on housing costs rather than relieving it.
This is not a forecast that prices only ever rise; monetary policy, credit conditions and the broader economy all matter, and housing has real cycles. But supply is the slow-moving foundation underneath all of it, and a market that keeps building below target has less room to cool through new stock alone. We set out where the market may head in our Australian property price forecast for 2027, and you can see how far prices have already moved in our guide to median house prices across Australia.
What does this mean if you are trying to buy?
Competition is likely to stay firm in the places where building lags demand, which on these figures means most of the country. Waiting for a supply flood that the official targets say will not arrive by 2029 is a risky plan. The more useful move is to get finance-ready so you can act when the right property appears.
You do not need to panic, and you should be sceptical of anyone using these numbers to rush you. But you should also read them honestly. On every measure that matters, the country is building at or below the pace it needs, and the official five-year projections do not show that reversing before 2029. Sitting on the sidelines waiting for a wave of new supply to push prices down is a bet against the data. The risk worth taking seriously is not mistiming the market, it is being caught unready. You cannot control when the right home appears, but you can control whether you are in a position to act when it does.
The practical response is not to buy in a hurry, it is to be ready. That means knowing your borrowing capacity, understanding the deposit you genuinely need, and having your finance lined up so that when a suitable home comes up you can move with confidence rather than scrambling. Our guide to the deposit needed by city across Australia shows what you are actually saving toward, and if you work in a recognised profession our guide to home loans for professionals explains how you may be able to buy sooner with a smaller deposit.
As Melbourne mortgage brokers and former bankers, our job is to translate numbers like these into a plan that fits your situation, not to sell you a story. If the honest answer is to wait and save a little longer, we will tell you that too. The fastest way to know where you stand is to have someone run the numbers with you. Book a no-cost chat and we will tell you honestly whether now is your moment or whether saving a little longer is the smarter play.
See what these numbers mean for your borrowing power
We will look at your borrowing capacity, the deposit you actually need, and the timing that makes sense for you, using real numbers, not headlines. No cost, no obligation.
Get my borrowing snapshotFrequently asked questions
How many homes does Australia need to build each year?
The National Housing Accord calls for 240,000 new homes a year to restore affordability. In the year to December 2025, Australia approved 196,832 homes, about 43,000 short of that target, and completed closer to 175,000, about 65,000 short. So the country is building below the pace it has set for itself.
Is Australia actually short on housing?
It depends how you measure it. Count one home per new person and the national gap looks like 215,668 homes, but that overstates the problem because Australians live about 2.5 to a household. Count one home per 2.5-person household and there is a small surplus of about 31,832 approvals. The honest shortage is homes against the 240,000-a-year Accord target, where approvals fall about 43,000 short.
Which state has the biggest housing gap?
It depends on the method. In raw numbers, Victoria and NSW show the largest one-home-per-person gaps because they add the most people. But measured per new home, the tightest supply is in Western Australia (2.7 people per approval) and the Northern Territory (5.1), the only two jurisdictions still short even on the generous 2.5-person household method.
Will the housing shortage push prices up?
Persistent undersupply against the affordability target tends to support prices and rents over time, because existing homes absorb more of the demand. It is not a guarantee of a straight line up, since rates, credit and the wider economy also matter, but building below target removes the cooling effect that abundant new supply would otherwise provide.
Is the Housing Accord on track?
No. On current projections the National Housing Supply and Affordability Council expects about 938,000 homes to be built against the Accord’s 1.2 million target, a shortfall of 262,000 homes by 2029. The Urban Development Institute of Australia estimates around 400,000 fewer homes than needed across the capital cities over the same period.
What happens if I book a chat?
You talk to a former banker, not a call centre. We look at your borrowing capacity, the deposit you actually need and your timing, using real numbers. There is no cost and no obligation, and if the honest answer is to wait and save a little longer, we will tell you that. If it helps, we point you to the right next step.
Not sure which of these numbers applies to you? That is exactly the kind of thing a quick, no-cost chat sorts out. Book a time with a former banker and we will run your borrowing capacity and deposit against today’s market, honestly.
Sources
Related guides
Read the numbers, then make your move
You have seen the honest maths. The next step is turning it into a plan that fits your income, your deposit and your timing. That is what we do, at no cost to you.
Get my borrowing snapshot