
Median House Prices in Australia (2026): Every Capital City Ranked
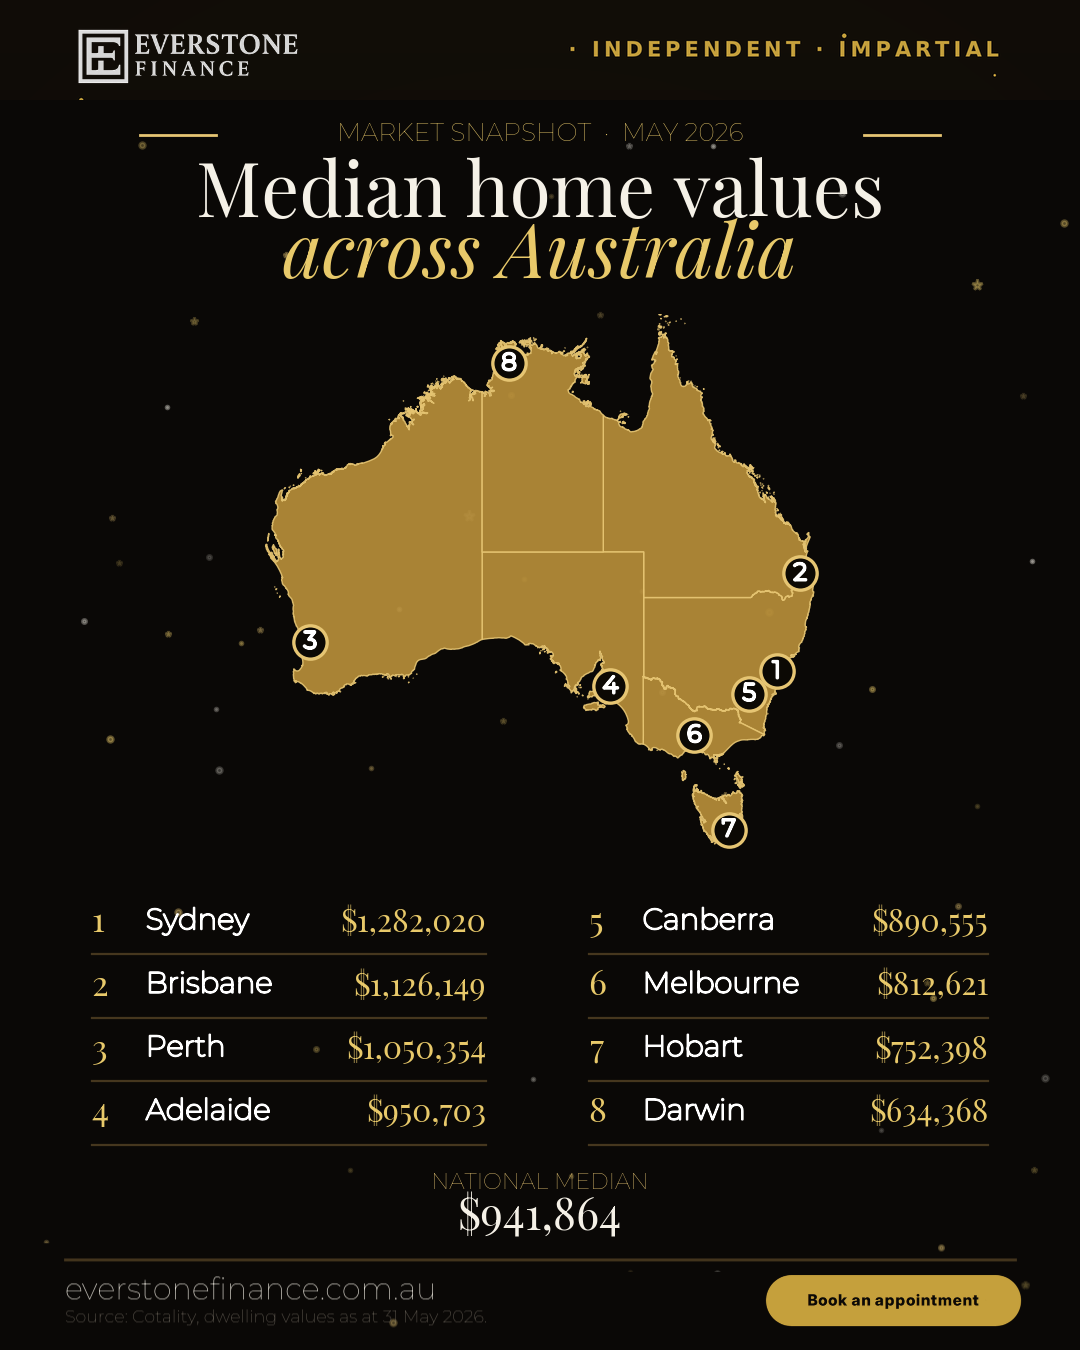
Median dwelling values across every Australian capital, as at 31 May 2026 (Cotality).
Prices are only half the story. For what each city's median home costs you per month, see our monthly repayments by city companion. To see which of these medians local incomes can actually carry, our affordability league table tests every city against the five-times-income benchmark. Those medians have now rolled over nationally: our ninth-downturn analysis covers the June fall and its 30-year context.
- The national median is $941,864, up 8.8% over the year to 31 May 2026 (Cotality median dwelling value, houses and units combined).
- Sydney is the most expensive capital at $1,282,020. Darwin is the most affordable at $634,368.
- Perth is the fastest-growing capital, up 25.8% over the year. Brisbane (+19.1%) and Darwin (+20.3%) also surged.
- Sydney (+2.3%) and Melbourne (+0.5%) barely moved, and both slipped slightly over the latest month, so the “Australian market” is really eight different markets.
- Combined capital cities sit at $1,030,973; combined regional Australia at $771,365.
Want to know what these prices mean for your deposit and borrowing power? Book a free chat with an ex-banker broker.
If you’re trying to make sense of median house prices in Australia in 2026, the single national number hides the real story. As at 31 May 2026, the national median dwelling value is $941,864, but that average stretches from a $1.28 million Sydney down to a $634,000 Darwin, and the cities that led the last decade are no longer the ones growing fastest. This guide ranks every capital city by median value, shows the annual growth behind each number, breaks down what it means for your deposit and borrowing power, and explains how to actually buy well in a market moving at eight different speeds. All figures are Cotality median dwelling values as at 31 May 2026, the way we’d walk a client through them at Everstone Finance.
Australia's national median dwelling value is $941,864 as at 31 May 2026, up 8.8% over the year (Cotality). Sydney leads capitals at $1,282,020, followed by Brisbane ($1,126,149) and Perth ($1,050,354). Melbourne sits lowest among the larger capitals at $812,621, with growth now concentrated in mid-sized cities.
Median house prices in Australia right now
As at 31 May 2026, the national median dwelling value in Australia is $941,864, up 8.8% over the year (Cotality). Capital city values range from $1,282,020 in Sydney, the most expensive, to $634,368 in Darwin, the most affordable. The combined capital cities median is $1,030,973 and combined regional Australia is $771,365.
The headline 8.8% annual growth makes the market sound uniformly hot. It isn’t. The growth is concentrated in the mid-sized capitals, Perth, Brisbane, Adelaide and Darwin, while the two biggest and most expensive markets, Sydney and Melbourne, have essentially flat-lined and even dipped over the most recent month. In practical terms, “the Australian property market” is now eight distinct markets, each with its own price point, growth rate and momentum. Treating them as one number is how buyers either talk themselves out of a city that’s still affordable, or overpay in one that’s already run hard.
Every Australian capital city ranked by median house price (2026)
Ranked from most to least expensive by median dwelling value (Cotality, 31 May 2026): 1. Sydney $1,282,020 · 2. Brisbane $1,126,149 · 3. Perth $1,050,354 · 4. Adelaide $950,703 · 5. Canberra $890,555 · 6. Melbourne $812,621 · 7. Hobart $752,398 · 8. Darwin $634,368. The national median is $941,864.
The most striking change is at the top. Brisbane and Perth have both overtaken Melbourne, and Adelaide now sits within touching distance of it too, an order that would have looked unthinkable a few years ago. Melbourne, long Australia’s second city by price, is now the sixth most expensive capital.
| Rank | City | Median value | Annual change |
|---|---|---|---|
| 1 | Sydney | $1,282,020 | +2.3% |
| 2 | Brisbane | $1,126,149 | +19.1% |
| 3 | Perth | $1,050,354 | +25.8% |
| 4 | Adelaide | $950,703 | +12.3% |
| 5 | Canberra | $890,555 | +4.3% |
| 6 | Melbourne | $812,621 | +0.5% |
| 7 | Hobart | $752,398 | +9.3% |
| 8 | Darwin | $634,368 | +20.3% |
| , | Combined capitals | $1,030,973 | , |
| , | Combined regional | $771,365 | , |
| , | National | $941,864 | +8.8% |
Capital city median house prices, city by city
Here’s what each capital’s number is telling buyers in 2026.
Sydney median house price: $1,282,020 (+2.3% year)
Sydney remains comfortably the most expensive capital, but it’s also one of the slowest-growing, up just 2.3% over the year and slightly softer over the most recent month. For buyers, a flat-to-soft Sydney can mean less frantic competition than the city’s reputation suggests, the affordability hurdle is the deposit and borrowing power, not a runaway price. Measured against incomes rather than raw prices, Sydney also sits among the least affordable cities in Australia and the world.
Brisbane median house price: $1,126,149 (+19.1% year)
Brisbane is the story of the cycle. Up 19.1% over the year, it has leapfrogged Melbourne and Canberra to become the second most expensive capital in the country. Strong interstate migration and tight supply have done the work. Buyers waiting for Brisbane to “come back to earth” have been waiting a long time.
Perth median house price: $1,050,354 (+25.8% year)
Perth is the fastest-growing capital in Australia, up 25.8% over the year, and has now pushed past the million-dollar mark. After a decade of underperformance, Perth has run hard on the back of a strong local economy and limited listings. It’s a reminder that yesterday’s cheapest capital can become this year’s headline.
Adelaide median house price: $950,703 (+12.3% year)
Adelaide’s quiet, consistent 12.3% rise has lifted it to within a whisker of the national million-dollar club and above Canberra and Melbourne. Long seen as an affordable alternative, Adelaide is repricing fast.
Canberra median house price: $890,555 (+4.3% year)
The capital’s capital sits mid-table at $890,555, with steadier 4.3% growth. Canberra tends to move with public-sector confidence and remains less volatile than the mining-state capitals.
Melbourne median house price: $812,621 (+0.5% year)
Melbourne is now the sixth most expensive capital, cheaper than Brisbane, Perth and Adelaide, after a near-flat year (+0.5%) and a small monthly dip. For buyers, Australia’s second-largest city is arguably its most interesting value story in 2026: a global city priced below several smaller capitals. Melbourne is also our home market, and we cover it suburb by suburb in the areas we serve.
Hobart median house price: $752,398 (+9.3% year)
After a sharp run-up and then a cooling, Hobart has found its feet again with 9.3% annual growth. It remains one of the more affordable capitals while offering lifestyle appeal that keeps demand resilient.
Darwin median house price: $634,368 (+20.3% year)
Darwin is the most affordable capital in Australia and, at +20.3%, one of the fastest-growing. For buyers and investors chasing entry price and yield, Darwin’s combination of the lowest median and strong growth stands out, with the usual caveat that smaller markets can be more volatile.
Capital cities vs regional Australia
As at 31 May 2026, the combined capital cities median dwelling value is $1,030,973, while combined regional Australia is $771,365, a gap of roughly $260,000. Regional markets surged through the early 2020s and remain well above pre-pandemic levels, but the capitals carry the higher median.
The capital, regional gap matters if you’re weighing a lifestyle move or a regional investment. A smaller regional median doesn’t automatically mean better value, rental demand, vacancy rates, lender appetite and resale depth all vary enormously between towns. The number is a starting point, not a verdict.
Why have median house prices moved like this in 2026?
Three forces explain the 2026 spread: interest rates (the RBA cash rate sits at 4.35% after rises this year, which cools the most expensive markets fastest), interstate migration (flowing into Brisbane, Perth, Adelaide and Darwin), and tight supply (not enough new listings or construction to meet demand). Together they explain why the cheaper capitals are growing fastest while Sydney and Melbourne have stalled.
Higher borrowing costs bite hardest where prices, and therefore loan sizes, are largest, which is part of why Sydney and Melbourne have cooled while more affordable capitals kept running. If you want the full picture on rates and what they do to your borrowing power, read our companion guide on interest rates and what a 4.35% cash rate means for buyers.
How much deposit do you need at each city’s median?
A 20% deposit avoids Lenders Mortgage Insurance (LMI). On the national median of $941,864 that’s about $188,373. On Sydney’s $1,282,020 median it’s about $256,404; on Darwin’s $634,368 median, about $126,874. You can buy with less, often 5 to 10%, but below 20% you generally pay LMI (or use a guarantor or eligible scheme).
| City | Median value | 20% deposit | 10% deposit |
|---|---|---|---|
| Sydney | $1,282,020 | $256,404 | $128,202 |
| Brisbane | $1,126,149 | $225,230 | $112,615 |
| Perth | $1,050,354 | $210,071 | $105,035 |
| Adelaide | $950,703 | $190,141 | $95,070 |
| Canberra | $890,555 | $178,111 | $89,056 |
| Melbourne | $812,621 | $162,524 | $81,262 |
| Hobart | $752,398 | $150,480 | $75,240 |
| Darwin | $634,368 | $126,874 | $63,437 |
| National | $941,864 | $188,373 | $94,186 |
Worth knowing: a smaller deposit isn’t a dead end. Depending on your situation you may be able to buy with 5 to 10% down using LMI, a family guarantee, or an eligible government scheme, and some professions can access reduced or waived LMI. A broker can tell you which path fits before you start house-hunting. Registered nurses and midwives, for example, can buy with a 10% deposit and no LMI through select lenders. And for business owners, the same buy-or-keep-renting question applies to premises, covered in our commercial property loans guide.
What median house prices mean for you as a buyer
A median is the midpoint of a market, not the price you’ll pay. What actually decides what you can buy is your borrowing power and deposit, and both vary by lender. Two lenders can differ by tens of thousands on the same income, so the median is a guide to the market, not a limit on you.
It’s easy to read a million-dollar median and assume a city is off the table. But medians lump houses and units together and span every suburb, the right unit, townhouse or outer-suburb house can sit well below the figure. The more useful question isn’t “what’s the median?” but “what can I borrow, across the whole market, and where does that put me?” For the full path from pre-approval to settlement, see our step-by-step guide to buying property in Australia.
How to buy smart in a multi-speed market
In a market moving at eight different speeds, the buyers who do well know their borrowing power across 30+ lenders, get pre-approved before they shop, and stay open to the cities and property types where value still exists, rather than chasing last cycle’s winner.
Three moves matter more than picking the “right” city: first, get your real borrowing power mapped across the market, not just one bank’s guess; second, lock in pre-approval so you can act when the right property appears; third, match the city and property type to your goals and budget rather than the headlines. A broker does the comparison work for you, and it costs you nothing. For how to choose one, see our guide to the questions to ask a mortgage broker before you commit.
Sources and useful references
See exactly what you can buy, free
Book a no-obligation chat and we’ll map your borrowing power across 30+ lenders and show you where you stand against the median in any capital, in plain English.
Book an appointmentMedian house price glossary
- Median house price
- The middle value of all sales in a market, half sold for more, half for less. It’s less skewed by extreme sales than an average, which is why it’s the standard property benchmark.
- Median dwelling value
- Cotality’s measure of the midpoint value of all dwellings (houses and units combined) in an area. The figures in this guide are median dwelling values.
- Combined capital cities
- An aggregate index of the eight greater capital city markets, used to track the “capitals” as a whole. It sits at $1,030,973 as at 31 May 2026.
- Combined regional
- An aggregate of dwelling values outside the greater capital cities. It sits at $771,365 as at 31 May 2026.
- Capital growth
- The increase in a property’s value over time, usually shown as an annual percentage. Reported here as the change over the year to 31 May 2026.
- Cotality
- The property data and analytics provider (formerly CoreLogic) whose home value indices are widely used to track Australian dwelling values.
- Borrowing power
- The maximum a lender will lend you, based on income, expenses, debts and the rate they assess you at. It varies between lenders and sets what you can actually buy.
- Lenders Mortgage Insurance (LMI)
- A one-off insurance cost lenders usually require when you borrow more than 80% of a property’s value (a deposit under 20%). Some buyers can reduce, waive or avoid it.
Median house price FAQ
What is the median house price in Australia in 2026?
As at 31 May 2026, the national median dwelling value in Australia is $941,864, up 8.8% over the year (Cotality, houses and units combined). Combined capital cities sit at $1,030,973 and combined regional Australia at $771,365.
What is the most expensive city to buy a house in Australia?
Sydney is the most expensive capital, with a median dwelling value of $1,282,020 as at 31 May 2026. It grew just 2.3% over the year, among the slowest of the capitals.
What is the cheapest capital city in Australia?
Darwin is the most affordable capital, with a median dwelling value of $634,368. Despite being the cheapest, it was one of the fastest-growing capitals over the year, up 20.3%.
Which capital city has the fastest-growing house prices?
Perth is the fastest-growing capital, up 25.8% over the year to 31 May 2026, with a median of $1,050,354. Darwin (+20.3%) and Brisbane (+19.1%) were also strong.
What is the median house price in Sydney?
Sydney’s median dwelling value is $1,282,020 as at 31 May 2026, up 2.3% over the year. It remains the most expensive capital in Australia.
What is the median house price in Melbourne?
Melbourne’s median dwelling value is $812,621 as at 31 May 2026, up just 0.5% over the year. Melbourne is now the sixth most expensive capital, cheaper than Brisbane, Perth and Adelaide.
What is the median house price in Brisbane?
Brisbane’s median dwelling value is $1,126,149 as at 31 May 2026, up 19.1% over the year. It is now the second most expensive capital city in Australia, ahead of Melbourne.
Is Brisbane more expensive than Melbourne now?
Yes. As at 31 May 2026, Brisbane’s median ($1,126,149) is well above Melbourne’s ($812,621). Perth and Adelaide have also overtaken Melbourne, which now ranks sixth among the capitals by median value.
What is the difference between a median house price and a median dwelling value?
A median house price usually refers to houses only, while a median dwelling value (the measure used here, from Cotality) covers all dwellings, houses and units combined. Because units are generally cheaper, a combined dwelling figure can sit a little below a houses-only median for the same area.
How much deposit do I need to buy a median-priced home in Australia?
A 20% deposit avoids Lenders Mortgage Insurance, about $188,373 on the national median of $941,864. You can often buy with 5 to 10% down, but below 20% you generally pay LMI, unless you use a guarantor, an eligible scheme, or a profession-based LMI waiver. A broker can tell you which applies to you.
Are Australian house prices going up or down in 2026?
It depends entirely on the city. Nationally, dwelling values rose 8.8% over the year to 31 May 2026, but that was driven by Perth, Brisbane, Adelaide and Darwin. Sydney and Melbourne were close to flat over the year and dipped slightly over the most recent month.
Where does this median house price data come from?
The figures in this guide are Cotality median dwelling values as at 31 May 2026. Property data is updated regularly, so confirm the latest figures before making any decision, and speak to a professional about your own circumstances.
Do I need to be in Melbourne or South Yarra to work with Everstone Finance?
No. Everstone Finance is based in South Yarra and meets locally in person, but works with clients across Melbourne and Australia-wide by phone and Zoom.
The bottom line: there is no single “Australian house price” in 2026, there are eight capital markets moving at different speeds, from a $1.28M Sydney to a $634k Darwin. The median tells you where a market sits; your borrowing power and deposit decide where you can buy. Know both before you start, and you turn a confusing market into a short list.
Map your borrowing power across 30+ lenders, free
No cost, no obligation. We’ll show you exactly what you can buy at today’s rates and where it puts you against the median in any capital, clearly and in writing.
Book an appointment