

Australia’s 10 Fastest-Growing Cities (2026): Where the Jobs Are Moving, What Each City Costs, and the Rentvesting Map
LinkedIn has just published its Cities on the Rise 2026 ranking for Australia: the ten metro areas where hiring, job postings and inbound migration are growing fastest, measured across millions of member profiles from March 2024 to February 2026. Lists like this usually get read as career trivia. Read it next to the affordability data instead and something remarkable appears: the two most affordable capital cities in the country, Hobart and Darwin, are the two fastest growing. Jobs are flowing toward affordability, while stretched lifestyle markets like the Gold Coast and Wollongong keep growing against price tags their own workers cannot carry. For anyone renting in Melbourne or Sydney and wondering how they ever get on the ladder, this collision of datasets points at a strategy with a name: rentvesting, living where your career is and buying where growth and affordability align. Here is the full ranking, what each city actually costs against local incomes, and how the lending works, written by former bankers in South Yarra. We took the Darwin story further during Garma week, pairing this ranking with the affordability data. The mechanics of actually doing it, from borrowing power to settlement, are in our step-by-step investment property guide. Where it heads next is in our Perth 2027 forecast.
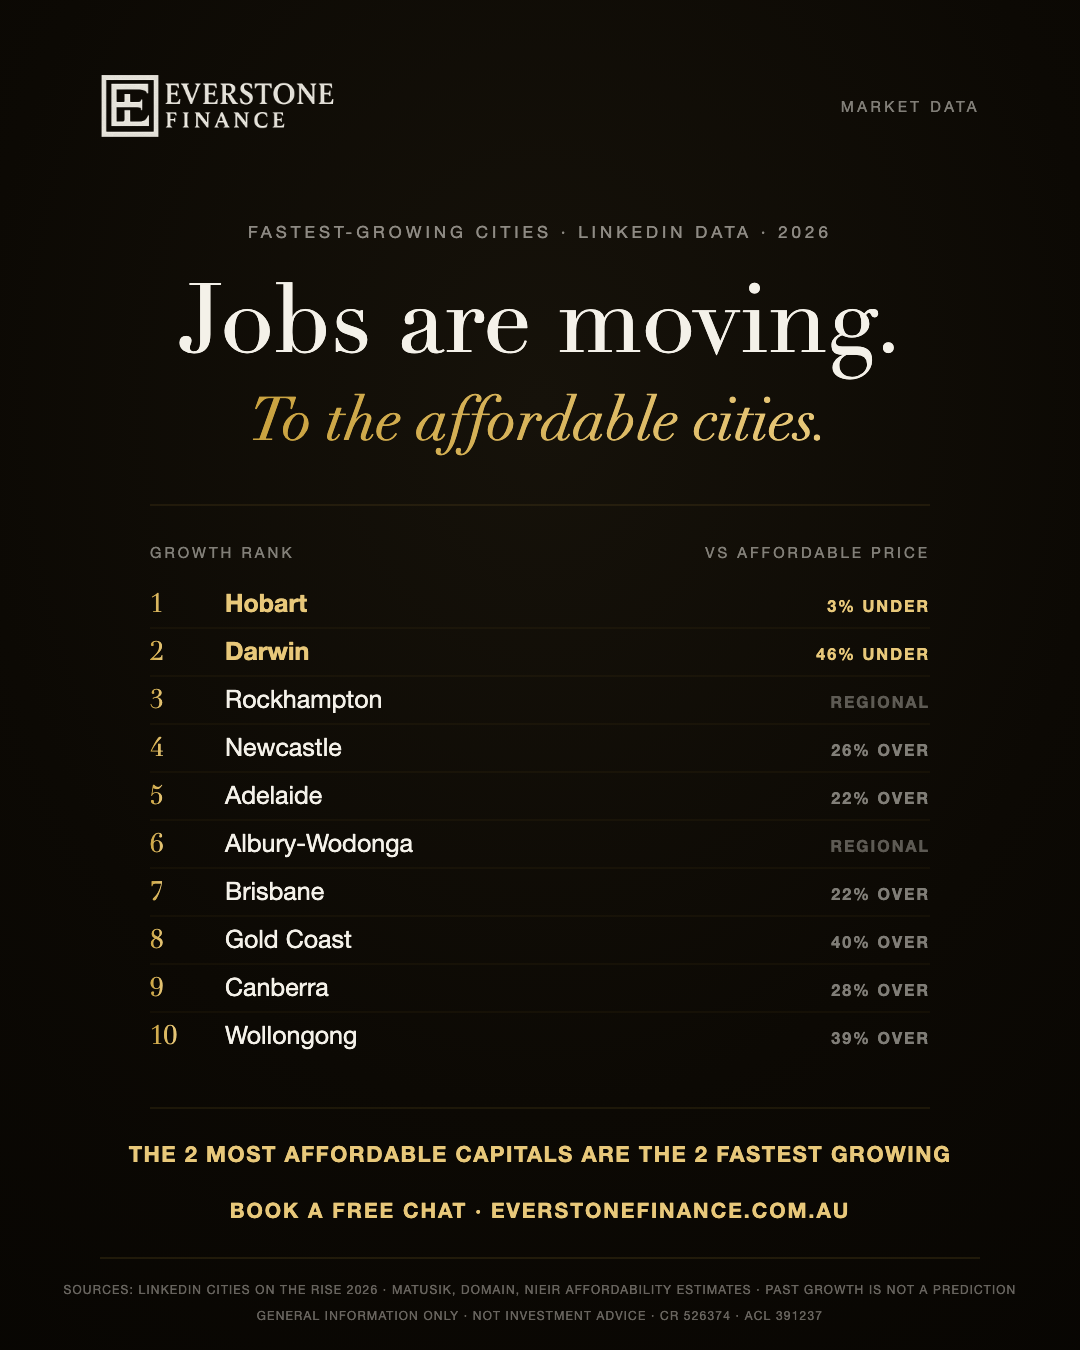
- LinkedIn’s 2026 ranking of Australia’s fastest-growing job markets: Hobart, Darwin, Rockhampton, Newcastle, Adelaide, Albury-Wodonga, Brisbane, Gold Coast, Canberra, Wollongong.
- Cross-referenced with 2026 affordability estimates, the two fastest growers are also the two most affordable capitals: Hobart sits 3 per cent under its affordable price and Darwin 46 per cent under.
- At the other end, the Gold Coast (40 per cent over) and Wollongong (39 per cent over) keep growing despite the country’s most stretched price tags.
- Rentvesting means renting where your life is and buying where the numbers work. It has real advantages and real trade-offs, including usually forfeiting first home buyer concessions.
- Lenders assess rentvesters on both sides of the ledger: the rent you pay and a shaded portion of the rent you would earn. Book a chat with a former banker and we will run your version of the maths, free.
The ranking: LinkedIn’s ten cities on the rise
LinkedIn’s Cities on the Rise 2026 ranks Australian metros by job market momentum, growth in hiring and job postings, and migration inflows, using member data from March 2024 to February 2026, with the largest metros excluded to surface emerging markets. The 2026 list runs: Hobart, Darwin, Rockhampton, Newcastle, Adelaide, Albury-Wodonga, Brisbane, Gold Coast, Canberra, Wollongong.
The methodology matters because it measures movement, not size: year-over-year growth in people starting new jobs and in postings, combined with the change in how many people are moving in versus moving out. Metro areas with more than three million members are excluded, which is why Sydney and Melbourne do not appear; the list is designed to catch the emerging markets. The 2026 ten, in order:
- 1. Greater Hobart, led by higher education, health and tourism growth.
- 2. Greater Darwin, on major defence, infrastructure and critical minerals investment.
- 3. Rockhampton, an energy, industrial and logistics story.
- 4. Greater Newcastle, clean energy and healthcare, with Sydney proximity.
- 5. Greater Adelaide, carried by the AUKUS submarine program and the Osborne shipyard build-out.
- 6. Greater Albury-Wodonga, freight, logistics and regional health.
- 7. Greater Brisbane, population growth and the 2032 Olympics runway.
- 8. Gold Coast, healthcare, education and technology expansion.
- 9. Canberra, defence, cybersecurity and government demand.
- 10. Wollongong, renewables and advanced manufacturing beside Sydney.
What each city costs: the affordability cross-reference
Setting LinkedIn’s growth ranking against 2026 affordability estimates, where a house is affordable at five times disposable household income: Hobart and Darwin are under their affordable price, Adelaide and Brisbane sit 22 per cent over, Newcastle 26, Canberra 28, Wollongong 39 and the Gold Coast 40 per cent over. The two regional entrants sit outside the benchmark dataset but well below capital-city price levels.
Growth is only half a decision; price is the other half. We published the full 2026 affordability league table last week, testing each market’s median house against five times local disposable income. Merge the two datasets and the map gets interesting:
| Growth rank | City | Versus affordable price | Read |
|---|---|---|---|
| 1 | Hobart | 3% under | Affordable and accelerating |
| 2 | Darwin | 46% under | The deepest value on the list |
| 3 | Rockhampton | Outside dataset | Regional pricing, energy-led growth |
| 4 | Newcastle | 26% over | Growing, already stretched |
| 5 | Adelaide | 22% over | Defence decade, mid-table price |
| 6 | Albury-Wodonga | Outside dataset | Regional pricing, logistics-led |
| 7 | Brisbane | 22% over | Olympic runway, mid-table price |
| 8 | Gold Coast | 40% over | Growing against the country’s worst stretch |
| 9 | Canberra | 28% over | High incomes, high prices |
| 10 | Wollongong | 39% over | Sydney’s price shadow |
Affordability figures are third-party market benchmarks for detached houses, not valuations or predictions; the two regional markets are not covered by the benchmark dataset but trade below capital-city medians. Past growth is not a reliable indicator of future performance.
Found the growth. Now fund the move.
Rentvesting or relocating into a growth market starts with the borrowing power to do it: a former banker runs your numbers across more than 40 lenders, free, before you shortlist.
Run my borrowing powerThe signal: jobs are moving toward affordability
The striking overlap is at the top: the two most affordable capitals in Australia are also its two fastest-growing job markets, pulled by healthcare, defence and infrastructure investment rather than lifestyle migration. Meanwhile the most stretched markets on the list, the Gold Coast and Wollongong, keep adding jobs against prices their local incomes already fail to support.
A note for the healthcare workers doing much of that hiring boom’s actual work: nurses can often buy with a 10 to 20 per cent deposit, and in many cases a 10 per cent deposit with no LMI at all. Our home loans for nurses guide explains who qualifies and how the waiver works.
For a decade, the Australian story was the reverse: jobs concentrated in Sydney and Melbourne while affordability lived where the work was not. The 2026 data describes something new. Hobart and Darwin, first and second for growth, are the only two capitals trading under their affordable price, and their growth is anchored in structural spending: defence builds, health systems, universities, critical minerals. That is employment that arrives with contracts and stays.
Two more reads worth making. Adelaide and Brisbane, mid-list for both growth and stretch, carry decade-long pipelines (AUKUS and the 2032 Olympics) that are as close to scheduled demand as this country produces; we flagged both dynamics in our ninth-downturn analysis, where both cities kept rising through June while Sydney and Melbourne fell. And the Gold Coast and Wollongong problem is the same one our affordability piece diagnosed: prices set by arriving money, now colliding with genuine local job growth, which is how rental markets get brutal.
None of this is a prediction, and a growth ranking is not investment advice. What it is, is a map of where demand for housing is being manufactured by employment, which is precisely the map a certain kind of buyer has been asking us for.
Rentvesting: the strategy the data points at
Rentvesting means renting the home that fits your life, often in Melbourne or Sydney, while owning an investment property where prices and growth conditions are better matched. It gets renters onto the property ladder without leaving their career, suburb or school zone, and the 2026 data, cheap capitals growing fastest while big-city rents climb, is the exact backdrop the strategy was designed for.
If you rent in Melbourne, our Q2 rents analysis put the national median at $705 a week and rising, and the ladder feels distant, rentvesting reframes the problem. Instead of “save until you can buy where you live”, it asks: what if the first property you own is not the one you live in? You keep renting the flexible, well-located home your life actually needs, and you buy where the entry price, rental yield and growth drivers stack up, which is what the table above is for. The strategy itself, what rentvesting is, the numbers and the tax trap, is explained from scratch in our dedicated guide.
The appeal is arithmetic. A 10 to 20 per cent deposit on a lower-priced growth market is a fraction of the deposit the same rung costs in Melbourne or Sydney, the rent your tenant pays services much of the loan, and you are in the market compounding instead of watching it from a lease. Our rental yields guide covers the income side of that equation city by city, and several of LinkedIn’s risers, Darwin at 46 per cent under its affordable price, Rockhampton in the middle of Queensland’s energy build, are exactly where the yield table and the growth table shake hands.
How rentvesting lending actually works
Rentvesting uses an investment loan, typically with a 10 to 20 per cent deposit, priced above owner-occupier lending. Serviceability counts both sides of your position: the rent you pay as an expense, and commonly around 70 to 80 per cent of the expected rental income as income. Structure, offset placement and lender choice matter more than in a simple owner-occupier purchase.
The lending mechanics are where rentvesting gets real, and where preparation pays:
- It is an investment loan. Investment lending is priced above owner-occupier lending and assessed on its own criteria. Deposits typically run 10 to 20 per cent, with LMI applying at the higher lending ratios just as it does for owner-occupiers.
- Both sides of your rent count. The rent you pay is treated as an ongoing expense in serviceability, and the rent your property will earn is counted as income, though lenders commonly shade expected rent to around 70 to 80 per cent to allow for vacancies and costs. How generously each lender treats each side varies enough to change your borrowing power materially, which is a matching exercise we run across 40+ lenders.
- Structure decides your flexibility. Offset accounts, interest-only periods and how the loan is set up affect both your cashflow now and your options later, including the classic rentvester endgame of eventually converting or selling to fund the home you do want to live in. Tax treatment, including negative gearing, depends on your circumstances and belongs with your accountant, though our negative gearing and borrowing capacity guide covers how lenders read it.
The honest trade-offs
Rentvesting usually forfeits first home buyer benefits, which mostly require living in the property; it adds landlord obligations, land tax exposure and the risks of a market you do not live in; and paying rent while holding a mortgage demands a real buffer. It is a strategy for some renters, not a default for all, and the numbers should be run before the enthusiasm.
We would rather lose a booking than oversell this, so plainly:
- You usually give up first home buyer concessions. The government’s 5 per cent deposit scheme, most state grants and stamp duty concessions generally require you to live in the property. Buying an investment first typically spends your first home buyer status without using its benefits, a trade-off our first home buyer guide lets you price precisely.
- Distance is a real cost. A property two flights away runs on property managers, buffer funds and trust in data over inspection. Vacancies, maintenance and land tax, which is assessed differently for investors and varies by state, all land on you.
- Two housing bills, one income. Your rent does not pause when your tenant leaves. Lenders stress-test this, and so should you: the strategy suits strong, stable incomes with genuine buffers, not budgets already at their edge.
Who does it genuinely suit? Renters whose careers anchor them to Melbourne or Sydney but whose deposits go much further elsewhere; households wanting market exposure before family timing lets them settle; and disciplined savers who would rather compound in the market they can afford than wait for the one they cannot. Whether that is you is a numbers conversation, not a slogan, and ours are free.
Rent where you live. Own where it works.
Tell us what you earn, what you pay in rent and what you have saved, and we will show you what a rentvesting purchase could look like across 40+ lenders, including whether the numbers genuinely beat waiting. Honest answer either way, no cost, no obligation.
Book a chat with a former bankerFrequently asked questions
What are the fastest-growing cities in Australia in 2026?
By LinkedIn’s Cities on the Rise 2026 ranking, which measures job market momentum and migration inflows from member data: Greater Hobart, Greater Darwin, Rockhampton, Greater Newcastle, Greater Adelaide, Greater Albury-Wodonga, Greater Brisbane, the Gold Coast, Canberra and Wollongong. Sydney and Melbourne are excluded by design, as the ranking removes metros above three million members to surface emerging markets.
Which of the fastest-growing cities are still affordable?
Cross-referenced with 2026 affordability estimates, Hobart and Darwin, the top two for growth, are the only capitals on the list trading under their affordable price, at 3 per cent and 46 per cent under respectively. Adelaide and Brisbane sit 22 per cent over, Newcastle 26, Canberra 28, while Wollongong at 39 and the Gold Coast at 40 per cent over are among the most stretched markets in the country.
What is rentvesting?
Rentvesting is renting the home that suits your life, typically in a big city close to work, while owning an investment property somewhere the entry price, rental yield and growth prospects stack up better. The tenant’s rent helps service the loan, you gain property market exposure without leaving your suburb, and the strategy trades first home buyer benefits and landlord simplicity for earlier entry.
Do rentvesters lose first home buyer benefits?
Usually, yes. The government’s 5 per cent deposit Home Guarantee Scheme and most state grants and stamp duty concessions require the property to be your home, so buying an investment first generally means forfeiting or spending those entitlements without their benefits. Rules differ by state and scheme, so pricing this trade-off precisely is part of the pre-purchase maths we run.
How much deposit does a rentvesting purchase need?
Investment loans typically want 10 to 20 per cent of the purchase price, with Lenders Mortgage Insurance applying at the higher lending ratios. Because entry prices in several of the fastest-growing markets sit far below Melbourne and Sydney levels, the dollar deposit required can be a fraction of what the same step costs in the city you rent in, which is much of the strategy’s appeal.
Does the rent I pay count against my borrowing power?
Yes. Lenders treat your ongoing rent as a living expense in serviceability, and they count the investment property’s expected rent as income, commonly shaded to around 70 to 80 per cent to allow for vacancies and costs. Different lenders weigh the two sides differently enough to change what you can borrow, which is why lender selection matters more for rentvesters than for standard purchases.
Is buying in a regional or interstate city risky?
It carries real risks: markets you do not live in, single-industry exposure in some regional economies, land tax that varies by state, and management at a distance. Growth rankings describe the recent past, not the future, and past performance is not a reliable indicator. The mitigations are boring and effective: conservative buffers, quality property management, diversified local economies, and running the numbers without the brochure adjectives.
Paying $700 a week in rent and reading growth rankings on your commute? That is the exact profile rentvesting was built for. Book a time with a former banker and find out what your deposit could do in the cities on the rise, free.
Sources
Related guides
About the author. Ahmed Lotfi is co-founder of Everstone Finance and a former banker who now works as a mortgage and finance broker in South Yarra, Melbourne, arranging home, investment and commercial lending for clients across Australia. Everstone Finance operates under the Best Interests Duty as Credit Representative 574314 of LMG Broker Services Pty Ltd, Australian Credit Licence 517921.
The jobs moved. The ladder moved with them.
Hobart and Darwin are growing fastest and still trade under their affordable price. Whether your deposit belongs there, or anywhere, is a numbers conversation, and running it costs nothing.
Book a chat with a former banker