

Housing Affordability in Australia (2026): Melbourne Is $86,000 From Affordable. Sydney Is $580,000.
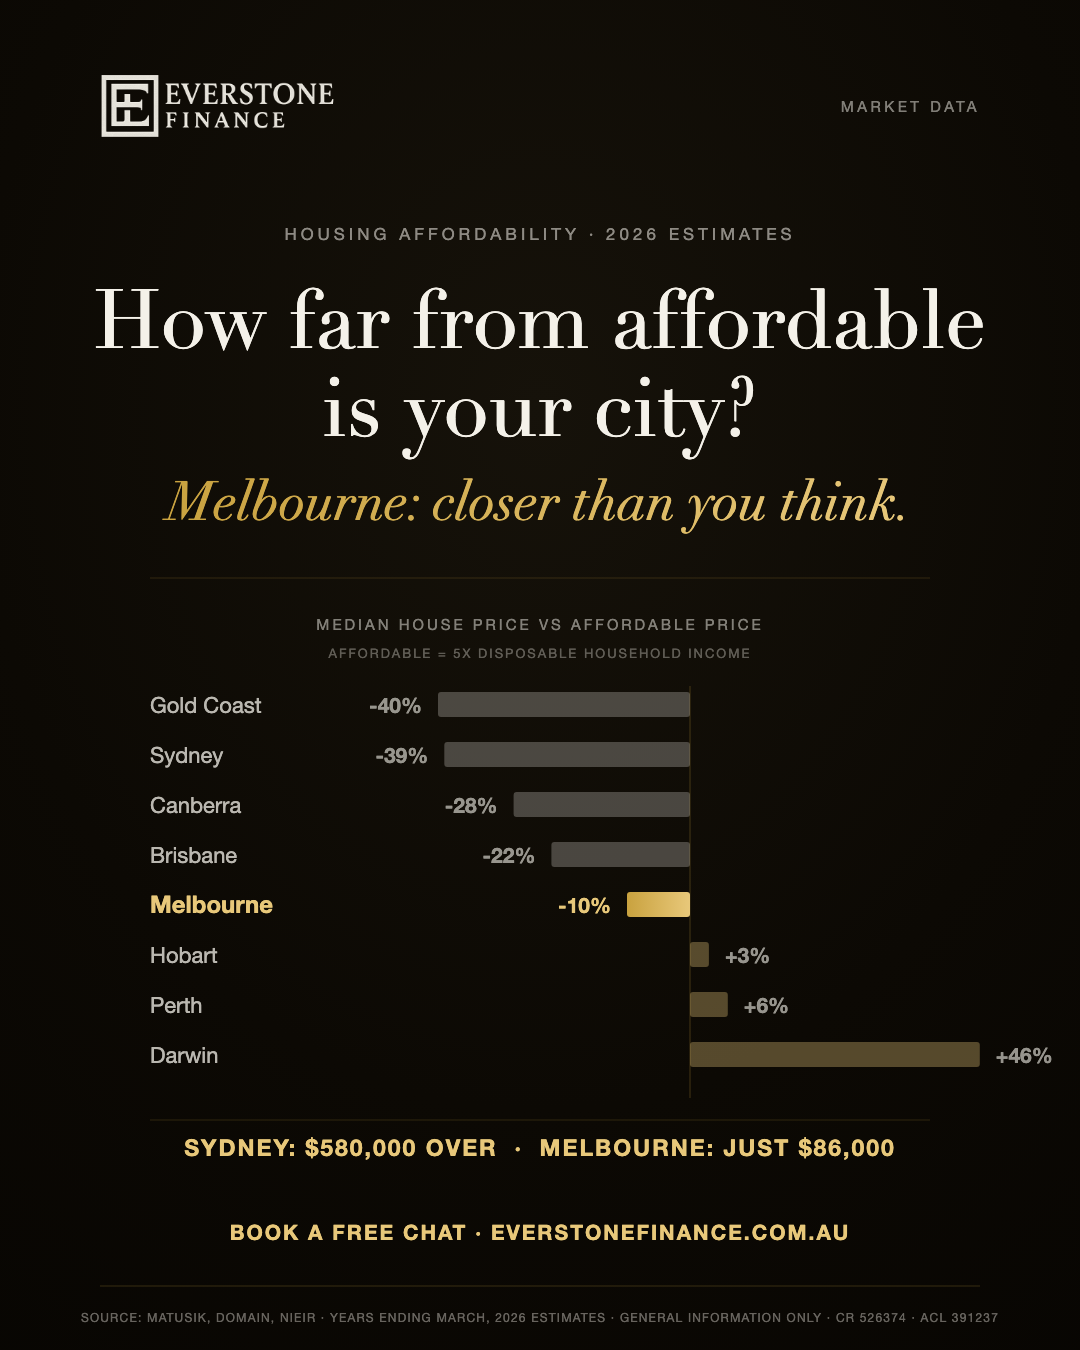
Every affordability story you have read this year says the same thing: it is bad everywhere. New 2026 estimates compiled by property analyst Michael Matusik, using Domain price data and household income modelling from the National Institute of Economic and Industry Research, say something more interesting: it is not bad everywhere, and the gaps between cities have become enormous. The benchmark is simple, a house is “affordable” when the median price sits at five times a household’s disposable income. Against that test, Sydney’s median house is $580,000 too expensive. The Gold Coast is further out than Sydney in percentage terms, the worst in the country. And Melbourne, the market everyone spent a decade calling broken? $86,000 from affordable. Ten per cent. The closest of any big capital, by a wide margin. Here is the full league table, what put Melbourne within reach, and who can actually act on it, written by former bankers in South Yarra. The cycle context matters too: Australia has just entered its ninth downturn in 30 years, and our downturn analysis covers what the previous eight did next.
- The benchmark: a house is affordable at five times disposable household income. 2026 estimates: Matusik, with Domain and NIEIR data.
- Melbourne is 10 per cent, or $86,000, above affordable, the closest of the five big capitals. Sydney is 39 per cent out, Brisbane and Adelaide 22, Canberra 28.
- The Gold Coast is the least affordable market in the country at 40 per cent over, worse than Sydney. Wollongong and the Sunshine Coast are close behind.
- Four markets are already at or below affordable: Darwin, Townsville, Perth and Hobart.
- Gaps like Melbourne’s tend to close through incomes and prices moving, not through headlines announcing the bottom. Book a chat with a former banker and find out what you can act on now.
- The benchmark: what “affordable” means here
- The 2026 league table, every market ranked
- The Melbourne story: how the broken market became the value market
- The stretched end: why the Gold Coast beats Sydney
- The affordable end: Darwin, Townsville, Perth, Hobart
- Who can act on this, and how
- Frequently asked questions
The benchmark: what “affordable” means here
The data defines an affordable house price as five times a household’s disposable income, income after tax, for each city. Compare that figure with the actual median detached house price and you get a dollar gap: how far each market sits above or below what its own residents can sustainably pay. Figures are for years ending March, with Matusik estimates for 2026.
Affordability debates usually drown in methodology, so it is worth being precise about this one. The five-times-disposable-income test is a long-standing rule of thumb for sustainable home ownership: it asks whether the people who live and earn in a city can buy the typical house in that city without heroic assumptions. The estimates here were compiled by Matusik Property Insights using Domain price data and NIEIR household income modelling, for years ending March, with 2026 estimated.
Two things make this framing more useful than the usual global rankings, including the one in our own least affordable cities guide, which measures Australia against the world. First, it is a dollar figure, not a ratio: Sydney being “$580,000 too expensive” tells you something a price-to-income multiple never quite lands. Second, it is local: each city is tested against its own incomes, which is the test that actually decides whether a teacher, a nurse or an engineer living there can buy there. And if you are that teacher or nurse, the lending side tilts your way: our home loans for nurses and home loans for teachers guides cover the 10 per cent deposit, no LMI deals that shrink the entry hurdle in a stretched market.
One honest caveat before the table: this is a benchmark about markets, not a lending assessment about you. Lenders do not use a five-times rule; they assess your specific income, debts and living costs. The benchmark tells you where the market sits. What you can borrow is a different number, and usually a more generous one for strong dual-income households.
The 2026 league table, every market ranked
Ranked from most stretched to most affordable: Gold Coast houses cost 40 per cent more than local affordability supports, Sydney 39, Wollongong 39, Sunshine Coast 35, Canberra 28, Newcastle 26, Brisbane 22, Adelaide 22, Geelong 12, Melbourne 10 and Cairns 8, while Hobart, Perth, Townsville and Darwin sit at or below affordable. The growth side of this map has since been published: LinkedIn’s 2026 ranking puts Hobart and Darwin, the two most affordable capitals here, as the two fastest-growing job markets, covered in our fastest-growing cities analysis. The Territory side of this table got its own deep-dive during Garma week, jobs data included.
The full table, ranked by how far the median house sits from that city’s affordable price:
| Market | Median house price | Affordable price at 5x income | Gap | Gap % |
|---|---|---|---|---|
| Gold Coast | $1,350,000 | $815,000 | $535,000 over | 40% over |
| Sydney | $1,500,000 | $920,000 | $580,000 over | 39% over |
| Wollongong | $1,180,000 | $715,000 | $465,000 over | 39% over |
| Sunshine Coast | $1,240,000 | $805,000 | $435,000 over | 35% over |
| Canberra | $1,020,000 | $735,000 | $285,000 over | 28% over |
| Newcastle | $1,050,000 | $775,000 | $275,000 over | 26% over |
| Brisbane | $1,120,000 | $875,000 | $245,000 over | 22% over |
| Adelaide | $900,000 | $700,000 | $200,000 over | 22% over |
| Geelong | $720,000 | $635,000 | $85,000 over | 12% over |
| Melbourne | $861,000 | $775,000 | $86,000 over | 10% over |
| Cairns | $769,000 | $705,000 | $64,000 over | 8% over |
| Hobart | $715,000 | $735,000 | $20,000 under | 3% under |
| Perth | $905,000 | $960,000 | $55,000 under | 6% under |
| Townsville | $660,000 | $730,000 | $70,000 under | 11% under |
| Darwin | $650,000 | $950,000 | $300,000 under | 46% under |
Detached house medians. General information only; the affordable price is a market benchmark, not a lending assessment or a prediction.
A different series, for context: the table above uses Matusik, Domain and NIEIR detached-house medians (years ending March, Matusik estimates for 2026). Cotality’s Home Value Index, a separate all-dwellings series, put the median values as at 31 August 2026 at Sydney $1,222,718, Melbourne $786,718, Brisbane $1,080,142, Adelaide $937,207, Perth $999,987, Hobart $752,397, Darwin $647,259 and Canberra $864,998. The two series measure different things and are not directly comparable, so the benchmark gaps above are left on their own figures.
Read down that table once and the national story stops being one story. There is a lifestyle-coast crisis at the top, a big-capital squeeze through the middle, and an affordable band at the bottom that includes two state capitals and the entire Northern Territory market. And sitting just above the affordable band, closer to Cairns than to Brisbane, is the second biggest city in the country.
Curious where your own budget sits against the market you want? WhatsApp, text or call Ahmed about what you earn, owe and hope to buy. His own mobile, no call centre, and no cost or obligation.
The Melbourne story: how the broken market became the value market
Melbourne’s median house sits 10 per cent above what local incomes support, against 22 per cent in Brisbane and Adelaide, 28 in Canberra and 39 in Sydney. Years of flat prices while incomes grew did the work. On this benchmark, Melbourne is the best-value big capital in Australia, and the gap is deposit-sized, not generation-sized.
For most of the last decade, “Melbourne property” and “affordability crisis” appeared in the same sentence. The 2026 numbers describe a different city. While Sydney, Brisbane, Adelaide and Perth ran hard through the mid-2020s, Melbourne’s prices went sideways and, in its premium suburbs, backwards, something we documented street by street in our premium suburb price falls analysis. Incomes did not go sideways. Grind those two lines against each other for a few years and you get this table: Melbourne at 10 per cent over affordable while every other big capital sits at 22 to 39.
Feel the difference in the dollar figures. Sydney’s gap is $580,000, a second mortgage. The Gold Coast’s is $535,000. Melbourne’s is $86,000, a number in the territory of a deposit, a good year of dual-income savings, or simply the gap between the median and the house one suburb over. And remember what a median is: the midpoint. Half of Melbourne’s houses sold below $861,000, and its units sit well below that again, which means a large share of the actual market is already trading inside the affordable zone. Our median house prices guide shows how rare that is among the big capitals.
Add the renter’s arithmetic and the picture sharpens further. Melbourne is simultaneously the cheapest big capital to buy relative to income and one of the cheapest capitals to rent, yet rents are climbing at their fastest pace in years, as we covered in our Q2 2026 rents analysis. A city where buying is nearly affordable and renting is getting expensive is a city where the spreadsheet argument for ownership quietly flips.
We make no prediction about where Melbourne prices go next; nobody rings a bell at the bottom, and this table is a snapshot, not a forecast. What we can say is that value gaps between capitals have historically narrowed over time, one way or another, and that “the most affordable big capital in the country” is not a status Melbourne has held often in the modern era. It is a window, and windows are defined by the fact that they close.
The stretched end: why the Gold Coast beats Sydney
The Gold Coast is 40 per cent over affordable, the worst in the country, with the Sunshine Coast at 35 and Wollongong at 39. Lifestyle markets price against buyers’ lifestyles, not residents’ incomes: sea-change and remote-work money set prices that local wages were never going to support.
The most striking line in the table is not Sydney. Sydney being expensive is wallpaper. It is that the Gold Coast, Wollongong and the Sunshine Coast now rival or exceed Sydney’s stretch, on local incomes that are far lower. The mechanism is no mystery: a decade of sea-changers, remote workers and interstate equity arriving with big-city money repriced those markets against the buyer’s income, not the resident’s. The result is a coastline where the median house costs $435,000 to $535,000 more than local households can sustainably carry.
Two practical consequences follow. If you are selling in a stretched market and moving to a better-value one, the table is your friend: the same move that felt sideways five years ago now crosses a 30-point affordability spread. And if you are buying in a stretched market because life, family or work demands it, structure matters more, not less: deposit strategy, lender selection and honest serviceability work are what make an expensive market purchasable. Both conversations are exactly what our deposit by city guide feeds into.
The affordable end: Darwin, Townsville, Perth, Hobart
Four markets sit at or below their affordable price: Darwin by a remarkable 46 per cent, Townsville by 11, Perth by 6 and Hobart by 3. Strong local incomes, especially in resource-linked economies, carry medians that look modest against east-coast prices.
At the other end of the table, Darwin’s median house costs $300,000 less than local incomes could support, a 46 per cent cushion that reflects the Territory’s high wages and a market still trading below its long-ago peak. Townsville and Perth carry the same signature in milder form: resource-economy incomes, moderate medians. Hobart, after its post-boom correction, has drifted back to roughly the line.
What do you do with that if you live in Melbourne or Sydney? For most owner-occupiers, nothing: you buy where your life is, and the table’s job is to tell you what your own market really costs. But for movers weighing a relocation with remote or portable work, and for investors thinking about where rents and values have income support behind them, the affordable band is a research starting point. Investment lending has its own structures, tax settings and risks, and deserves specific advice rather than a table and enthusiasm; that is a conversation we have every week, and it starts with the numbers rather than the postcard.
Who can act on this, and how
First home buyers can pair Melbourne’s near-affordable pricing with the government’s 5 per cent deposit scheme. Upgraders are trading within the best-value big capital in the country. Interstate buyers and investors are looking at a spread between markets that has rarely been wider. In every case the first step is the same: know your real borrowing power before the market moves.
Data is only worth publishing if someone can use it. Honestly, plainly, here is who this table serves:
- Melbourne first home buyers. You are shopping in the only big capital within sight of its affordable price, at the same time as the government’s 5 per cent deposit scheme removes the LMI wall for eligible buyers. Half the city’s houses trade below the median; units trade below that. The full stack of grants and concessions is in our first home buyer guide.
- Melbourne upgraders. The move from your current home to the next one is priced in the most income-supported big-city market in Australia, and premium-suburb prices have already corrected, as our falls analysis showed. Upgrading into a soft patch of a fair-value market is historically the cheap way to do it.
- Interstate and sea-change households. The spread between where you sell and where you buy has rarely mattered more. A Sydney or Gold Coast exit into a Melbourne, Geelong or affordable-band purchase crosses the widest value gap in the table.
- Waiters. If your plan is to wait until your city reaches “affordable” before buying, look at the table again: the markets that reached affordability did so over long cycles, and our history of waiting for perfect rates shows how that strategy has priced out two generations of waiters. Readiness beats prediction.
In every case the actionable number is not in this table. It is your own: what you can borrow, what it costs, and what buffer you carry. That is a conversation, not a benchmark, and ours are free: in person with our mortgage brokers in Melbourne, or by phone from anywhere in Australia.
The market is $86,000 from affordable. How far are you?
Tell us what you earn, what you owe and what you are hoping to buy, and we will tell you your real borrowing power across 40+ lenders, and whether now is your window or not. Honest answers either way. No cost, no obligation.
Book a chat with a former bankerFrequently asked questions
What does “affordable” mean in this data?
A house price equal to five times a household’s disposable income, income after tax, in that city. The figures were compiled by Matusik Property Insights using Domain price data and NIEIR income modelling, for years ending March, with 2026 estimated. It is a market benchmark for sustainable ownership, not a lending rule: lenders assess your individual income, debts and expenses, not a multiple.
Which Australian cities are actually affordable in 2026?
Four markets in the data sit at or below their affordable price: Darwin, where the median house costs 46 per cent less than local incomes support, Townsville at 11 per cent under, Perth at 6 per cent under and Hobart at 3 per cent under. Every east-coast capital and lifestyle market sits above the line, from Cairns at 8 per cent over to the Gold Coast at 40 per cent over.
Is Melbourne really the most affordable big capital?
Relative to its own incomes, yes, and it is not close: Melbourne’s median house is 10 per cent above its affordable price, against 22 per cent for Brisbane and Adelaide, 28 for Canberra and 39 for Sydney. In dollars the gap is $86,000, versus $580,000 in Sydney. Perth, Hobart and Darwin score better still, but among the five biggest capitals Melbourne stands alone.
How much income does the Melbourne median imply?
The benchmark’s own arithmetic: Melbourne’s affordable price of $775,000 divided by five implies a disposable household income of about $155,000, and carrying the actual $861,000 median at five times would imply roughly $172,000 after tax. Those are benchmark figures, not lending criteria; what a lender will actually approve depends on your full financial position, and is often a different number.
Why is the Gold Coast less affordable than Sydney?
Because its prices are set by arriving money rather than local wages. A decade of sea-changers, remote workers and interstate equity repriced Gold Coast housing against big-city incomes, while the local income base grew far more slowly. At 40 per cent over its affordable price it now tops the national table, with the Sunshine Coast at 35 per cent and Wollongong at 39 per cent showing the same lifestyle-market signature.
Does this mean Melbourne prices are about to rise?
The table is a snapshot of value, not a forecast, and we do not make price predictions. What can be said is that Melbourne has rarely held the position of best-value big capital, that value gaps between markets have historically narrowed over time, and that waiting for a market to become perfectly affordable has been an expensive strategy in Australia. Buying decisions should run on your numbers, not on timing the index.
Does the benchmark cover units and townhouses?
No, the medians here are for detached houses. Units and townhouses trade well below house medians in every market, which means the entry point in each city sits considerably closer to, or inside, the affordable zone than the headline figures suggest. In Melbourne especially, a large share of the unit market already prices below the city’s affordable benchmark of $775,000.
One number worth knowing before the next inspection: yours. Borrowing power moves with rates, policies and lender appetite, and it is the number every other number in this article answers to. Book a time with a former banker and get it confirmed, free.
Sources
Related guides
About the author. Ahmed Lotfi is co-founder of Everstone Finance and a former banker who now works as a mortgage and finance broker in South Yarra, Melbourne, arranging home, investment and commercial lending for clients across Australia. Everstone Finance operates under the Best Interests Duty as Credit Representative 574314 of LMG Broker Services Pty Ltd, Australian Credit Licence 517921.
Ten per cent from affordable. Once in a cycle.
Melbourne has not held the title of best-value big capital often, and no table announces when it stops. One conversation confirms your borrowing power, your buffer and your plan.
Book a chat with a former banker