

Australia’s Ninth Housing Downturn in 30 Years Just Started (2026): Here Is What the Last Eight Did Next
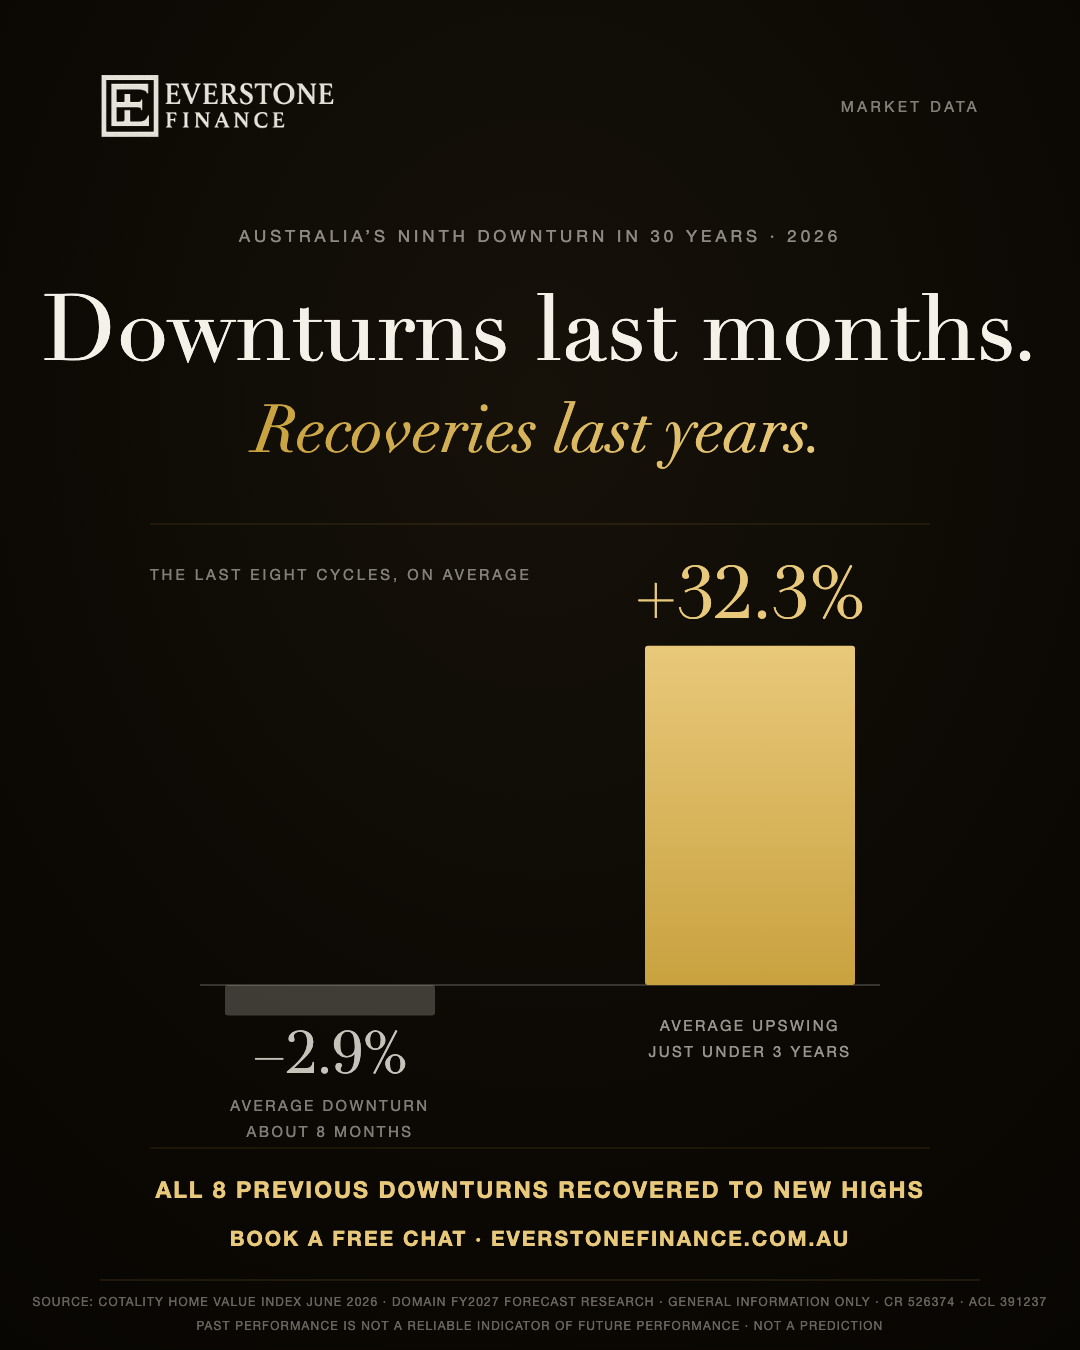
The national numbers finally rolled over. Cotality’s Home Value Index fell 0.4 per cent in June, then the sharpest monthly decline since December 2022, a record July immediately beat with a 0.7 per cent fall of its own. The market peaked in March, Sydney led July at 1.4 per cent with Melbourne at 1.2, and the commentary followed both, loudly. Here is the context the headlines keep leaving out: by Domain’s count, this is Australia’s ninth housing downturn in 30 years. The previous eight averaged a 2.9 per cent decline over roughly eight months. The upswings that followed averaged 32.3 per cent over just under three years, and every single one of the eight carried prices past their old peak. That asymmetry, dips measured in months, recoveries measured in years, is the single most useful fact in Australian property, and it is the reason the prepared buyer treats a month like June as an alarm clock rather than an alarm. Written by former bankers in South Yarra, with every figure sourced below.
- Cotality’s national index fell 0.4 per cent in June and 0.7 per cent in July, the sharpest monthly fall since December 2022. The market peaked in March, and the downturn is now national: regional Australia fell for the first time since January 2023.
- It is a two-speed market by price, not just by city: Sydney fell 1.4 per cent and Melbourne 1.2 in July, yet nationally the upper quartile is down 3.2 per cent in three months while the lowest tier is up 0.3 per cent.
- Domain’s research counts this as the ninth downturn in 30 years: the previous eight averaged a 2.9 per cent dip over about eight months, and all eight recovered to new highs.
- The upswings that followed averaged 32.3 per cent over just under three years. Downturns are short; recoveries are long. That is the window arithmetic.
- Forecasters currently disagree in both direction and size, which is exactly why readiness beats prediction. Book a chat with a former banker and get your buying power confirmed while competition is thin.
August update, added 3 September 2026: the ninth downturn did not pause. Cotality’s August print (results as at 31 August 2026, published 1 September) showed the national index down a further 0.9% for the month, a fifth consecutive monthly decline, taking values 3.1% lower over the quarter and 3.6% below the March peak, to a national median of $912,885. The combined capitals fell 1.1% in August and 93% of capital city suburbs recorded a fall through winter. The June and July analysis below stands; August broadened the downturn rather than ending it. The city-by-city forecasts are in our 2027 property price forecast.
What actually happened in June and July
Cotality’s national Home Value Index fell 0.4 per cent in June 2026 and another 0.7 per cent in July, the largest single-month decline since December 2022. Sydney fell 1.4 per cent in July and Melbourne 1.2, Brisbane and Adelaide recorded a second consecutive monthly fall, and regional Australia declined for the first time since January 2023. The expensive end is leading it down: upper-quartile values fell 3.2 per cent in three months while the lowest tier rose 0.3 per cent. The employment data agrees with the split: LinkedIn’s 2026 growth ranking, covered in our fastest-growing cities analysis, is led by the affordable capitals.
Update, 3 August. The July index made it a trend rather than a blip. Nationally values fell 0.7 per cent, the largest single-month decline since December 2022: Sydney 1.4 per cent, Melbourne 1.2, Brisbane 0.6 and Adelaide 0.2, with revisions showing a second consecutive fall for both, while Perth managed 0.1 per cent of growth. Regional Australia slipped 0.2 per cent, its first fall since January 2023. Listings are running 5.7 per cent above the five-year average and auction clearance rates have sat below 50 per cent since late May. The sharpest detail sits inside the tiers: upper-quartile values are down 3.2 per cent over three months while the lowest tier is up 0.3 per cent, a wedge that changes the arithmetic for anyone trading up. We have worked that wedge through properly, dollar by dollar, in our piece on why the changeover maths now favours upgraders. The demand data has now landed too: Westpac reported mortgage applications down 20 per cent since the May budget, and forecast investor housing credit growth to roughly halve into 2027, as reported by Reuters on 10 August.
Strip the drama and the June result reads like this. The national index, which had been grinding higher for three years, slipped 0.4 per cent in a month. The peak, in hindsight, was March 2026, and the June quarter closed 0.7 per cent below it. Cotality’s research director Tim Lawless attributed the turn to a familiar stack of headwinds: stretched affordability, interest rates, cost-of-living pressure, weak sentiment, and the property taxation changes announced in the federal budget, the same changes whose suburb-level effects we mapped in our Melbourne premium price falls analysis. The next input lands soon: the RBA’s 11 August meeting arrives with markets now expecting a hold. For what falling values mean for your own balance sheet, our piece on negative equity and the calm playbook covers it with a ten-second position checker. One group watching the premium falls especially closely: expats, whose buy-back window is being reshaped by the recovering dollar at the same time.
But the national number is an average wearing a blindfold. Underneath it, the market is running at two completely different speeds:
- Falling: Sydney, down 1.2 per cent in June, the biggest drag on the national result. Melbourne, down 1.0 per cent. Canberra, down 0.6 per cent.
- Flat: Adelaide, unchanged for the month.
- Still rising: Brisbane, up 0.3 per cent, and Perth, up 0.7 per cent in June and roughly 24 per cent over the year, which on its median works out to close to $200,000 in twelve months, near $4,000 a week.
So “the market fell” is really “the two biggest cities fell while the resource capitals kept climbing.” Whether you should care depends entirely on which market you are buying in, which is the first reason national headlines make poor personal advice.
Wondering what a softer market means for the purchase you had planned? WhatsApp, text or call Ahmed and talk it through for your city, not the national headline. His own mobile, no call centre, and the first chat is free.
The 30-year pattern: eight downturns, eight recoveries
Domain’s research counts nine national downturns in 30 years including this one. The previous eight averaged a 2.9 per cent peak-to-trough decline over roughly eight months, the worst annual fall in any of them stayed under 8 per cent, and every one was followed by a recovery that pushed prices to new highs.
June’s fall is news. What it usually leads to is history, and the history is unusually consistent. According to research published with Domain’s FY2027 forecast report, Australia has now entered its ninth housing downturn since the mid-1990s. The pattern across the previous eight:
- Average decline: 2.9 per cent, peak to trough. Not 20 per cent. Not the crash the comment section promises every cycle.
- Average duration: roughly eight months. Downturns in Australian housing have historically been brief.
- Worst case: under 8 per cent was the deepest annual fall recorded in any of the eight.
- Strike rate of recovery: eight from eight. Every previous downturn was followed by an upswing that carried values past the old peak.
For scale: prices across the combined capitals would need to fall 22.8 per cent just to revisit their March 2023 levels. That is how much ground the last upswing, 29.6 per cent over three years, put between today’s market and the previous cycle’s floor. Average downturns do not give back a fraction of that.
The honest footnote belongs here too: history is a pattern, not a promise, and past performance is not a reliable indicator of future performance. Eight recoveries do not guarantee a ninth. What the record does establish is the base rate, and the base rate says Australian downturns have been short, shallow and followed by growth that dwarfed them.
The asymmetry: months down, years up
The defining feature of the Australian cycle is asymmetry: declines averaging 2.9 per cent over eight months against upswings averaging 32.3 per cent over almost three years. Buyers who need the window get months; buyers who wait for certainty historically watched years of growth arrive before their confirmation did.
Put the two halves of the cycle side by side and the strategic picture writes itself. The average downturn: minus 2.9 per cent, about eight months. The average upswing: plus 32.3 per cent, just under three years. The market spends most of its life going up, and the interruptions have been brief. That asymmetry has two practical consequences.
First, the buying window is the short half. The stretch where sentiment is bleak, auction rooms are quiet and vendors meet the market has historically lasted about as long as a school year. Right now, capital city auction clearance rates are running near 40 per cent, against roughly 60 per cent in a balanced market. That is the statistical signature of thin competition: fewer bidders, more passed-in properties, more room to negotiate, the same conditions we described from the ground in our premium falls piece.
Second, the cost of waiting for certainty compounds. The moment a recovery is obvious, it is priced. The last upswing added 29.6 per cent in three years; a buyer who waited out its first year for confirmation paid for the confidence at settlement. We wrote the long version of this argument in our history of waiting for perfect rates: in Australian property, certainty has always been the most expensive thing you can buy.
Could this time be different?
Possibly, and the professionals cannot agree: Domain’s forecasts have Sydney falling up to 7 per cent and Melbourne 8 per cent over the next financial year, while KPMG began the year forecasting national growth of 7.7 per cent for 2026. When credentialed forecasters point in opposite directions, prediction is not a strategy. Readiness is.
Every cycle, someone argues this downturn is the one that breaks the pattern, and honesty requires taking the argument seriously. The bear case is real: affordability is stretched in the big cities, as our 2026 affordability league table quantifies, the budget’s property tax changes introduced a variable no previous cycle carried, and Domain’s own forecast has Sydney falling as much as 7 per cent and Melbourne 8 per cent over the coming financial year, which would make this downturn deeper than the historical average.
And yet, in January, KPMG forecast national dwelling prices to rise 7.7 per cent in 2026. Two respected houses, opposite signs, same market. That disagreement is not an embarrassment to forecasting; it is information. It tells you the range of professional opinion spans the entire question, which means any plan built on one forecast being right is a coin flip wearing a suit.
Our position is the one we have held in every piece this year: we make no price predictions. What we can observe is that the conditions buyers say they are waiting for, less competition, more negotiating room, vendors meeting the market, are measurable now, in the falling half of the two-speed market, and that history has priced the habit of waiting for the all-clear.
The Melbourne triangulation
Melbourne sits at the centre of three datasets at once: prices falling 1.0 per cent in June with premium suburbs already repriced, the smallest gap to affordability of any big capital at $86,000, and rents rising 5.9 per cent. A market that is cheaper to buy, nearly affordable, and more expensive to rent is a market where the ownership arithmetic has quietly flipped.
Zoom from the national picture to our home market and three separate datasets, from three separate reports, point the same direction:
- Prices: already repriced. Melbourne fell 1.0 per cent in June and its premium suburbs corrected hard after the budget, with monthly falls up to $90,000 in Albert Park, as we documented in the falls analysis.
- Value: closest to affordable. On 2026 estimates, Melbourne’s median sits just 10 per cent, $86,000, above what local incomes support, the best of any big capital, per our affordability league table.
- Rents: still climbing. National rents rose 5.9 per cent over the year to a record $705 a week, and Melbourne’s rental market is tightening from the cheapest-capital base, per our Q2 rents analysis.
Falling purchase prices, near-affordable value, rising rents. For a Melbourne household weighing “keep renting or buy”, those three lines are the whole decision, and right now all three lean the same way. No other capital shows that alignment: Sydney is falling but remains $580,000 from affordable; Perth is affordable but rising at $4,000 a week.
What to do with a downturn, honestly
Buyers: get finance ready while clearance rates are thin, because pre-approval is the asset a quiet market rewards. Upgraders: trading up in a falling market is mathematically cheaper, since the gap between your sale and your purchase narrows. Sellers without a reason to sell: history argues against crystallising an average 2.9 per cent dip. Owners: review the loan, not the index.
Cutting the commentary into instructions, by situation:
- If you are buying: the conditions you were waiting for have arrived, and they are historically brief. A 40 per cent clearance rate means half the competition of a hot market. The buyer who wins in this stretch is the one whose finance is already arranged, because a vendor facing a thin room takes the offer that can settle. Pre-approval first, inspections second.
- If you are upgrading: a falling market is the cheap time to trade up. Your current home sells for a little less, but the bigger home you are buying falls by more in dollar terms, and the changeover gap, the only number that matters, narrows. Waiting for your own sale price to recover means paying more for the step up.
- If you are thinking of selling with nowhere to go: the historical base rate, a 2.9 per cent average dip followed by recovery to new highs eight times from eight, is an argument for not crystallising a paper loss out of fear. Personal circumstances rule, but panic is not a circumstance.
- If you are staying put: the index is not your problem; your rate is. A downturn is when lenders compete hardest for safe, existing borrowers, and a loan review costs nothing.
Every one of those moves starts with the same number: what you can actually borrow, at today’s rates, under today’s policies. That number moves with the market, and knowing it is free.
Downturns average eight months. Pre-approvals take far less.
Tell us what you earn, what you owe and what you are aiming for, and we will confirm your real buying power across 40+ lenders, so a quiet market can work for you instead of around you. Honest answers, no cost, no obligation.
Book a chat with a former bankerFrequently asked questions
Is the Australian property market crashing in 2026?
The data does not describe a crash: the national index fell 0.4 per cent in June and sits 0.7 per cent below its March peak. For context, the previous eight downturns since the mid-1990s averaged a 2.9 per cent total decline, and the worst annual fall in any of them stayed under 8 per cent. Forecasts differ on how deep this cycle runs, and history is not a guarantee, but the recorded falls so far are a correction, not a collapse.
How long do Australian housing downturns usually last?
About eight months on average across the eight downturns since the mid-1990s, with an average peak-to-trough decline of 2.9 per cent, according to research published with Domain’s FY2027 forecast report. Every one of those eight was followed by an upswing that pushed prices to new highs, averaging 32.3 per cent over just under three years. This cycle can differ, and past performance is not a reliable indicator of future performance.
Which cities fell in June 2026 and which rose?
Sydney fell 1.2 per cent, Melbourne 1.0 per cent and Canberra 0.6 per cent, while Adelaide was flat and Brisbane and Perth rose 0.3 and 0.7 per cent respectively, per Cotality’s June index. Perth is up roughly 24 per cent over the year. The national fall of 0.4 per cent is an average of two markets moving in opposite directions, which is why city-level data matters more than the headline.
Why are Perth and Brisbane still rising while Sydney and Melbourne fall?
Different cycles, different fundamentals: the resource-state capitals carry stronger local income growth and started from lower price bases, and Perth in particular has run about 24 per cent higher over the year to March, close to $200,000 on its median. Our affordability league table shows Perth still testing as affordable against local incomes even after that run, while Sydney and Melbourne carry the stretch that makes them rate-sensitive.
Should I wait for the bottom of the market before buying?
Nobody identifies the bottom until it has passed, and professional forecasters currently disagree in both direction and size: Domain projects further falls of up to 7 to 8 per cent in Sydney and Melbourne over the coming financial year, while KPMG began 2026 forecasting 7.7 per cent national growth. What is measurable today is thin competition, with clearance rates near 40 per cent. The historical pattern is that buyers get months of those conditions, not years, so preparation tends to beat prediction.
Is a downturn a bad time to sell?
If you are selling without buying again, an average downturn historically meant crystallising a dip of around 2.9 per cent that recovered within a few years, eight times from eight. If you are selling to upgrade, a falling market usually works in your favour: the home you buy typically falls by more dollars than the home you sell, narrowing the changeover gap. The right answer is personal, and running both numbers before listing costs nothing.
What does the downturn mean for Melbourne buyers specifically?
Melbourne currently shows an alignment no other capital has: prices fell 1.0 per cent in June with premium suburbs already repriced, the city sits just $86,000 from its affordable benchmark, the closest of any big capital, and rents are rising 5.9 per cent from the cheapest-capital base. Cheaper to buy, nearly affordable, dearer to rent: for households weighing renting against owning, all three lines currently lean the same way.
The last eight downturns ended the same way: with prices at new highs and buyers wishing they had been ready. Whether the ninth follows the script, nobody knows. Your borrowing power, we can know this week. Book a time with a former banker, free.
Sources
Related guides
About the author. Ahmed Lotfi is co-founder of Everstone Finance and a former banker who now works as a mortgage and finance broker in South Yarra, Melbourne, arranging home, investment and commercial lending for clients across Australia. Everstone Finance operates under the Best Interests Duty as Credit Representative 574314 of LMG Broker Services Pty Ltd, Australian Credit Licence 517921.
Months of window. Years of consequence.
The eight downturns before this one rewarded the households that used them. One conversation confirms your borrowing power, your buffer and your plan for the quiet stretch.
Book a chat with a former banker